Infographics. An infographic is basically just a visual image used to represent data. Great infographics can be very useful in that they convey a lot of information in a little space that can be easily interpreted.
Classroom Use. I like the idea of using infographics in the classroom. I wouldn’t only create them myself, but I feel it could be a great learning experience to have students create one themselves. There are some great sites available that have neat templates, but there are some students who would enjoy using Photoshop or inDesign to create one entirely by themselves. I find that many teachers have great resources hanging on their wall, but they never refer to them, or even explain them to students. Infographics on the wall may look good, but are pointless if not used.
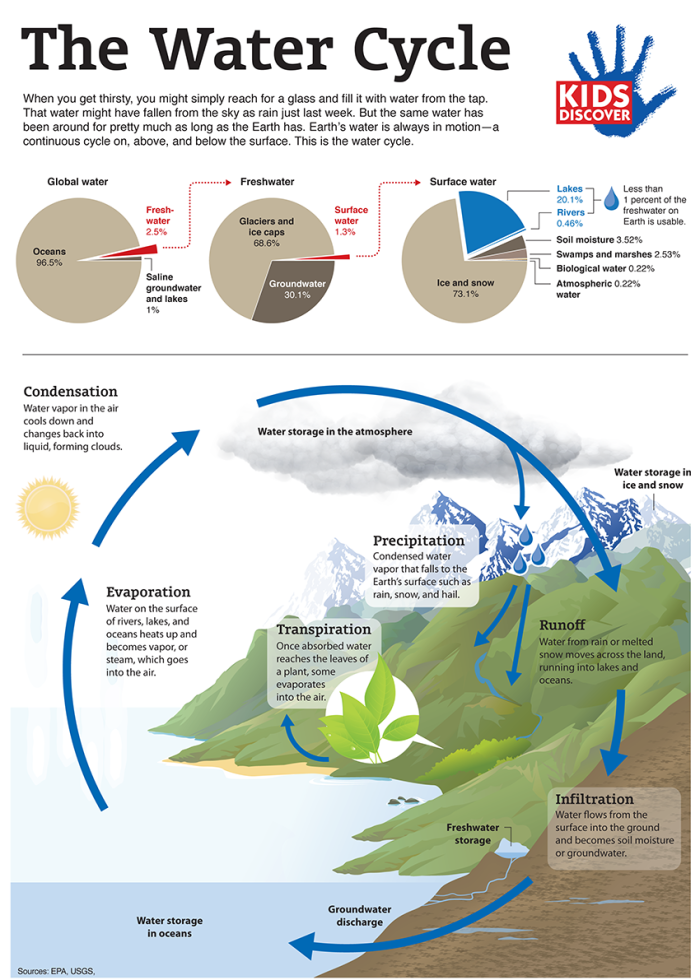
Infographics can help students understand important, but complicated concepts. In grade 2 students are already learning about the water cycle and for students who struggle with the science language (such as EAL students) using infographics could be very beneficial.
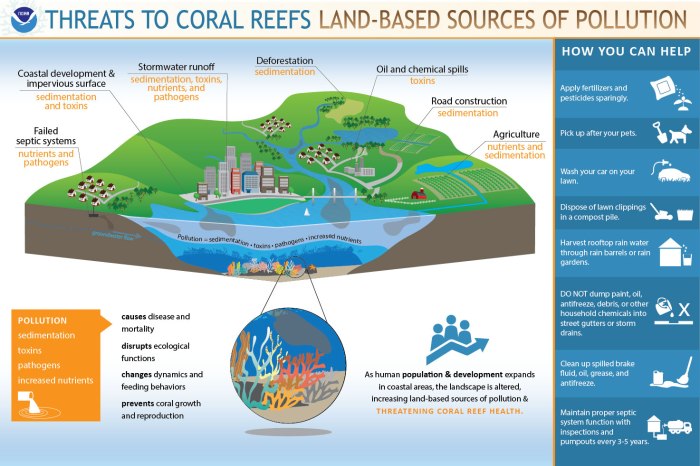
Infographics about world issues such as pollution would also be great for the classroom.
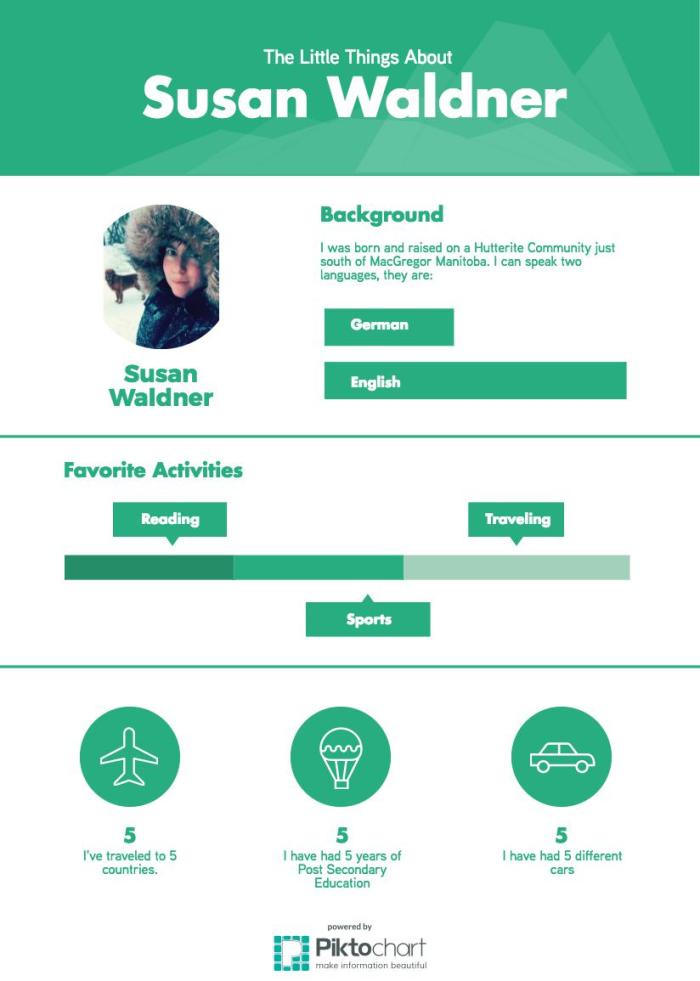
I was playing around with Piktochart to create an infographic. Using their templates, it was quite easy to piece something together.